


Page 572 - JobsPlus - Occupational Handbook
P. 572
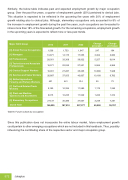
Similarly, the below table indicates past and expected employment growth by major occupation group. Over the past five years, a quarter of employment growth (25%) pertained to clerical jobs. This situation is expected to be reflected in the upcoming five years with 20% of employment growth relating also to clerical jobs. Although, elementary occupations only accounted for 8% of the increase in employment growth during the past five years, such occupations are forecasted to inhere more than 18% of the forecasted growth. For the remaining occupations, employment growth in the upcoming years is expected to reflect more or less past trends.
 Major ISCO Group
  2012
   2017
 2022
     Change 2012 / 2017
 Change 2017/2022
  [0] Armed Forces Occupations
 1,506
 1,753
 1,947
   247
  194
  [1] Managers
  10,871
  14,175
  17,555
     3,304
   3,380
  [2] Professionals
  28,051
   33,308
 39,922
     5,257
  6,614
  [3] Technicians and Associate Professionals
 16,571
  22,535
27,501
   5,964
 4,966
  [4] Clerical Support Workers
 16,901
 27,287
 35,235
   10,386
  7,948
  [5] Services and Sales Workers
  26,887
  37,055
  43,837
     10,168
   6,782
  [6] Skilled Agricultural, Forestry and Fishery Workers
 421
  441
514
   20
 73
  [7] Craft and Related Trade Workers
 9,160
 10,334
 11,580
   1,175
  1,245
  [8] Plant and Machine Operators and Assemblers
 9,015
 10,235
 11,549
   1,220
  1,314
  [9] Elementary Occupations
  27,137
  30,386
  37,637
     3,249
   7,251
  Grand Total
  146,520
   187,510
 227,277
     40,990
  39,767
  Table 6: Future outlook by occupation
Since this publication does not incorporate the entire labour market, future employment growth could pertain to other emerging occupations which are not included in this handbook. Thus, possibly influencing the contributing share of the respective sector and major occupation group.
Jobsplus
 572


