


Page 26 - JobsPlus - Occupational Handbook
P. 26
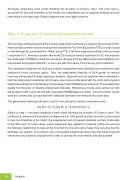
Stochastic projections were made following the principle of Occam’s razor. The error term μt accounted for any non-linearities in the model, the unexplained sum of squared residuals and any irrationality in the data used. Expert judgment was once again relied on.
Step 2: Projection of Sectoral Employment Growth
The next step entailed projecting the industry employment necessary to produce the projected GVA. Historical data used for industry employment followed the Full-Time Equivalent (FTE) concept, based on the National Accounts definition. When using FTE, a full-time employee working a 40 hour week is equivalent to 1, whereas a person who works 20 hours per week is equivalent to 0.5. Assumptions are made within STEMM to make the necessary changes from the National Accounts definition to a harmonised employment definition, to be in line with the Labour Force Survey (LFS) definition.
The correlations between the GVA and industry employment were identified and coefficients were obtained for each economic sector. Thus, the employment elasticity of GVA growth at sectoral level was extrapolated through regression analysis. Separate sectoral equations were estimated to infer the employment elasticities, which were once more corroborated with the short and long-term elasticities inferred from the Ministry’s forecasting model STEMM at sectoral level. These elasticities enable the inference of industry employment forecasts. Robustness checks were carried out with actual data for 2017 up to Q3 and with forecasted STEMM data up to 2022. The econometric results were also viewed and corroborated with statistical estimates from National Accounts data.
The generalised model specification used for forecasting the industry employment was:
Log (Et) = β1 + β2 [log (Et-1)] + β3 [log (GVAt)] + μt
Similar to step 1, stochastic projections were made following the principle of Occam’s razor. The coefficient β1 measured the elasticity of employment to GVA growth and the error term μt accounted for any non-linearities in the model, the unexplained sum of squared residuals and any irrationality in the data used. In some cases, expert judgement was applied to forecasts, taking into account the historical relationship in place at the time that the forecasts were made, thus ensuring that the estimates are realistic. The analysis also incorporated judgements about new and future expected trends that may influence employment in order to provide the most realistic forecast possible.
 Jobsplus
 26


